Ruby on Rails Performance: 7 Lessons from Scaling FirstPromoter
When your Rails app grows from a handful of users to millions of referrals across thousands of programs, performance becomes the whole job. I work on FirstPromoter, an affiliate tracking platform powering 7,000+ affiliate programs. Over the years we’ve had to figure out how to keep things fast as the traffic kept growing.
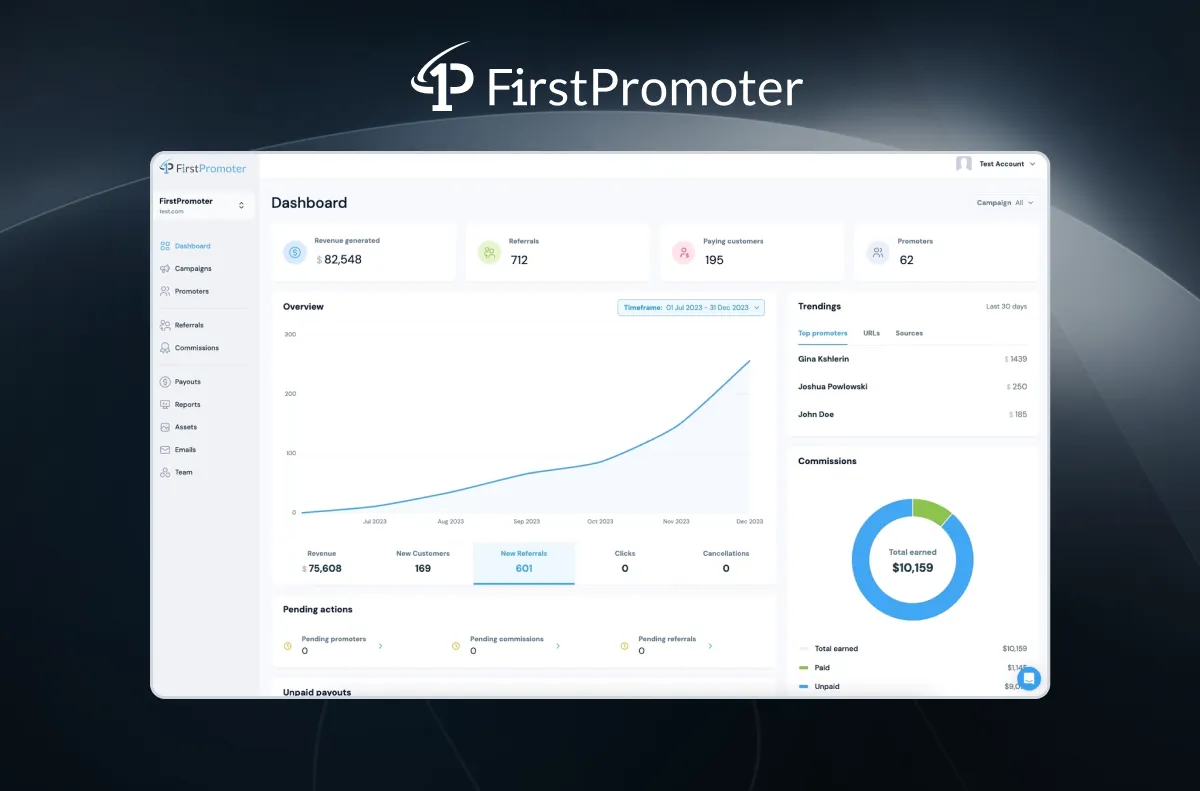 The FirstPromoter dashboard — the page that used to time out
Here’s what a typical week looks like in production:
| Metric | Value |
|---|---|
| Requests / week | 35.5M |
| Payment webhooks / week | 10.3M |
| Avg webhook response | 23ms |
| Peak requests / hour | 318K |
That’s more than double the throughput from last year (15.7M → 35.5M) — while simultaneously making things faster. We process payment webhooks from Stripe, Chargebee, Braintree, and Paddle — about 1.47 million per day. Each one needs to be fast and reliable because it directly affects revenue attribution for our customers.
Here are seven lessons we learned the hard way.
1. Counter Caching Saves More Than You Think
Our dashboard showed counts everywhere — active promoters per campaign, pending referrals, total commissions. Each one a COUNT(*) query hitting PostgreSQL in real time.
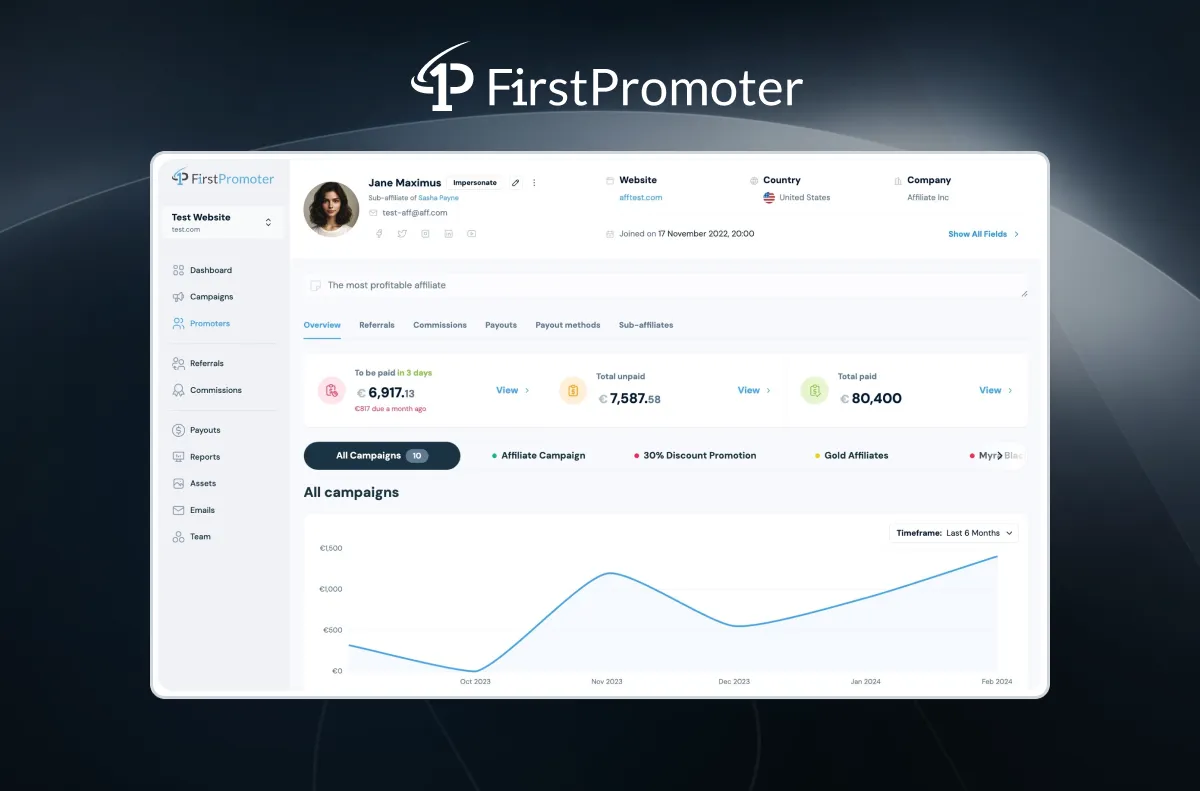 Promoter detail view — counts everywhere, each one a potential COUNT query
Rails’ built-in counter_cache got us started, but we graduated to counter_culture for conditional counts and multi-level caching.
The real lesson wasn’t “add counter caches” though — it was scope your cache refreshes. We were recalculating counters for archived and inactive companies on every cron sweep. Scoping the refresh to active companies only cut our background job time dramatically:
# Before: refreshing everything, including dead data
Campaign.counter_culture_fix_counts

# After: scope to what actually matters
Company.active.find_each do |company|
  Campaign.counter_culture_fix_counts(
    where: { company_id: company.id }
  )
end
We also moved reconciliation to an async worker that reads from a replica database — so the hourly counter refresh doesn’t touch the primary at all:
CounterCulture.configure do |config|
  config.use_read_replica = Rails.env.production?
end
Our dashboard stats endpoint went from 10s+ to 2.5s, and the promoter listings that used to choke on COUNT queries now load in under 500ms.
2. N+1 Queries: Preloading Too Much Is as Bad as Too Little
Everyone knows to fix N+1 queries. The less obvious lesson: preloading too aggressively can be just as bad. We’ve seen developers throw every association into includes and wonder why memory usage spikes.
We run Bullet and Prosopite in development to catch issues, but the real discipline is profiling first, then adding preloads only for what the serializer actually touches. Nothing more.
3. Redis for the Hot Path
When you’re processing 1.47M webhooks per day, every millisecond in your hot path counts. We use Redis for four things:
Webhook queue. We don’t process webhooks inline. Validate the payload, enqueue a Sidekiq worker, return 200. The actual business logic happens in the background. That’s how we handle 10M+ webhooks per week — the response time is just validation and enqueue.
Atomic counters. Email send counts, tracking events — anything high-frequency that would cause database contention. We increment in Redis and flush to PostgreSQL periodically.
Revenue caching. Dashboard revenue calculations that join multiple tables get cached in Redis with Sidekiq workers refreshing on a schedule. The dashboard loads instantly while data stays reasonably fresh.
Rails cache store. Query and fragment caching backed by Redis with connection pooling — essential to prevent connection exhaustion under load.
4. Sidekiq: Tune It Like an Engine
With over 100K scheduled jobs in queue at any given time, Sidekiq tuning isn’t optional.
Dedicated processes for critical paths. We run separate Sidekiq processes for tracking (most latency-sensitive), mailers, and general work. A bulk CSV export shouldn’t be able to starve real-time webhook processing.
Queue limits. sidekiq-limit_fetch sets explicit concurrency limits per queue. Without it, a flood of low-priority jobs monopolizes every worker.
Consolidate related workers. We had separate workers for archiving promoters, referrals, and commissions. Consolidating them into a single job with SQL FILTER aggregation cut database round-trips and was far easier to reason about.
# sidekiq.yml — separate concerns
:queues:
  - [tracking, 10]
  - [critical, 8]
  - [mailers, 5]
  - [default, 3]
  - [low, 1]
5. Know When PostgreSQL Isn’t Enough
Our dashboard analytics — trending charts, revenue breakdowns, time-series comparisons — were bringing PostgreSQL to its knees. Queries scanning millions of records timing out at 30 seconds. Not slow — literally timing out.
We migrated the analytics layer to Google BigQuery. Same queries that timed out in PostgreSQL now run in under 2 seconds. But not everything belongs in BigQuery — we initially moved too aggressively and actually reverted some queries back when the added complexity wasn’t justified. Our rule of thumb: if a query scans hundreds of thousands of rows or involves complex time-series aggregations, BigQuery. Everything else stays in PostgreSQL.
Here’s where things stand now — 95th percentile response times over the last 30 days:
| Namespace | P95 |
|---|---|
| Webhooks | 85ms |
| Background | 1,969ms |
| API | 3,426ms |
95% of API requests complete under 3.4s. These are the same analytics queries that used to time out at 30s.
6. Database Views for Complex Reports
We started with the Scenic gem to create PostgreSQL views for reporting queries that would otherwise require joining five or six tables every time. That worked until it didn’t — the views got too complex and too slow as the data grew. We ended up moving the heavy ones to BigQuery, where the same join logic runs over millions of rows without breaking a sweat. The simpler views still live in PostgreSQL where they belong.
7. Batch Size Is a Tuning Parameter
When exporting large datasets, batch size dramatically affects both memory and speed. We iterated from the Rails default of 1,000 up to 50,000 (memory issues) and back down. The answer: different sizes for different models. A lightweight model handles 50K batches fine. A model with multiple eager-loaded associations might cap out at 5K before memory gets uncomfortable.
Where the Traffic Comes From
Payment webhooks dominate our traffic. Here’s the breakdown by provider:
| Provider | Weekly Volume |
|---|---|
| Stripe | 5.8M |
| Chargebee | 3.7M |
| Braintree | 287K |
| Paddle | 113K |
| Recurly | 36K |
Each integration has its own payload format, retry behavior, and edge cases. We keep an eye on all of it through AppSignal for performance monitoring, Better Stack for logs, Bullet/Prosopite for N+1 detection, and strong_migrations to keep deploys safe.
These lessons came from years of working on FirstPromoter. If you’re building a SaaS and thinking about launching an affiliate or referral program, give it a try.